
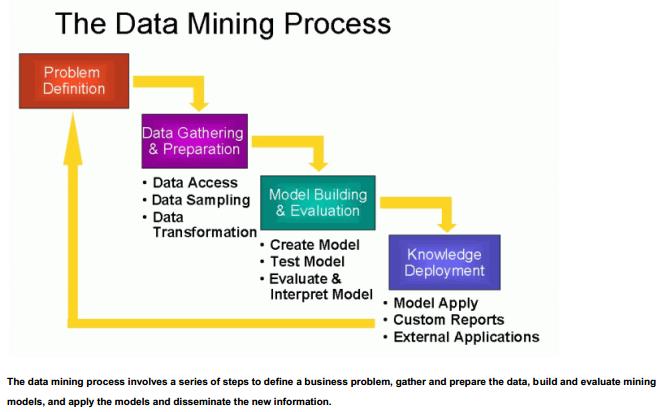
The Data Mining Process

Generally, data mining (sometimes called data or knowledge discovery) is the process of analyzing data from different perspectives and summarizing it into useful information - information that can be used to increase revenue, cuts costs, or both. Data mining software is one of a number of analytical tools for analyzing data. It allows users to analyze data from many different dimensions or angles, categorize it, and summarize the relationships identified. Technically, data mining is the process of finding correlations or patterns among dozens of fields in large relational databases.
Data mining is the process that results in the discovery of new patterns in large data sets. It utilizes methods at the intersection of artificial intelligence,machine learning, statistics, and database systems. The overall goal of the data mining process is to extract knowledge from an existing data set and transform it into a human-understandable structure for further use.
Data mining involves database and data management aspects, data pre-processing, model and inference considerations, interestingness metrics, complexity considerations, post-processing of found structures,visualization, and online updating.
Companies have used powerful computers to sift through volumes of supermarket scanner data and analyze market research reports for years. However, continuous innovations in computer processing power, disk storage, and statistical software are dramatically increasing the accuracy of analysis while driving down the cost.
Data are any facts, numbers, or text that can be processed by a computer. Today, organizations are accumulating vast and growing amounts of data in different formats and different databases. This includes:
- operational or transactional data such as, sales, cost, inventory, payroll, and accounting
- nonoperational data, such as industry sales, forecast data, and macro economic data
- meta data - data about the data itself, such as logical database design or data dictionary definitions
The patterns, associations, or relationships among all this data can provide information. For example, analysis of retail point of sale transaction data can yield information on which products are selling and when.
Information can be converted into knowledge about historical patterns and future trends. For example, summary information on retail supermarket sales can be analyzed in light of promotional efforts to provide knowledge of consumer buying behavior. Thus, a manufacturer or retailer could determine which items are most susceptible to promotional efforts.
Data Warehouses
Dramatic advances in data capture, processing power, data transmission, and storage capabilities are enabling organizations to integrate their various databases intodata warehouses. Data warehousing is defined as a process of centralized data management and retrieval. Data warehousing, like data mining, is a relatively new term although the concept itself has been around for years. Data warehousing represents an ideal vision of maintaining a central repository of all organizational data. Centralization of data is needed to maximize user access and analysis.
Dramatic technological advances are making this vision a reality for many companies. And, equally dramatic advances in data analysis software are allowing users to access this data freely. The data analysis software is what supports data mining.
What can data mining do?
Data mining is primarily used today by companies with a strong consumer focus - retail, financial, communication, and marketing organizations. It enables these companies to determine relationships among "internal" factors such as price, product positioning, or staff skills, and "external" factors such as economic indicators, competition, and customer demographics. And, it enables them to determine the impact on sales, customer satisfaction, and corporate profits. Finally, it enables them to "drill down" into summary information to view detail transactional data.
With data mining, a retailer could use point-of-sale records of customer purchases to send targeted promotions based on an individual's purchase history. By mining demographic data from comment or warranty cards, the retailer could develop products and promotions to appeal to specific customer segments.
For example, Netflix mines its video history database to recommend rentals to individual customers. American Express can suggest products to its cardholders based on analysis of their monthly expenditures.
WalMart is pioneering massive data mining to transform its supplier relationships. WalMart captures point-of-sale transactions from over 2,900 stores in 6 countries and continuously transmits this data to its massive 7.5 terabyte Teradata data warehouse. WalMart allows more than 3,500 suppliers, to access data on their products and perform data analyses. These suppliers use this data to identify customer buying patterns at the store display level. They use this information to manage local store inventory and identify new merchandising opportunities. In 1995, WalMart computers processed over 1 million complex data queries.
The National Basketball Association (NBA) is exploring a data mining application that can be used in conjunction with image recordings of basketball games. The Advanced Scout software analyzes the movements of players to help coaches orchestrate plays and strategies. For example, an analysis of the play-by-play sheet of the game played between the New York Knicks and the Cleveland Cavaliers on January 6, 1995 reveals that when Mark Price played the Guard position, John Williams attempted four jump shots and made each one! Advanced Scout not only finds this pattern, but explains that it is interesting because it differs considerably from the average shooting percentage of 49.30% for the Cavaliers during that game.
By using the NBA universal clock, a coach can automatically bring up the video clips showing each of the jump shots attempted by Williams with Price on the floor, without needing to comb through hours of video footage. Those clips show a very successful pick-and-roll play in which Price draws the Knick's defense and then finds Williams for an open jump shot.
How does data mining work?
While large-scale information technology has been evolving separate transaction and analytical systems, data mining provides the link between the two. Data mining software analyzes relationships and patterns in stored transaction data based on open-ended user queries. Several types of analytical software are available: statistical, machine learning, and neural networks. Generally, any of four types of relationships are sought:
- Classes: Stored data is used to locate data in predetermined groups. For example, a restaurant chain could mine customer purchase data to determine when customers visit and what they typically order. This information could be used to increase traffic by having daily specials.
- Clusters: Data items are grouped according to logical relationships or consumer preferences. For example, data can be mined to identify market segments or consumer affinities.
- Associations: Data can be mined to identify associations. The beer-diaper example is an example of associative mining.
- Sequential patterns: Data is mined to anticipate behavior patterns and trends. For example, an outdoor equipment retailer could predict the likelihood of a backpack being purchased based on a consumer's purchase of sleeping bags and hiking shoes.
Data mining consists of five major elements:
- Extract, transform, and load transaction data onto the data warehouse system.
- Store and manage the data in a multidimensional database system.
- Provide data access to business analysts and information technology professionals.
- Analyze the data by application software.
- Present the data in a useful format, such as a graph or table.
Different levels of analysis are available:
- Artificial neural networks: Non-linear predictive models that learn through training and resemble biological neural networks in structure.
- Genetic algorithms: Optimization techniques that use processes such as genetic combination, mutation, and natural selection in a design based on the concepts of natural evolution.
- Decision trees: Tree-shaped structures that represent sets of decisions. These decisions generate rules for the classification of a dataset. Specific decision tree methods include Classification and Regression Trees (CART) and Chi Square Automatic Interaction Detection (CHAID) . CART and CHAID are decision tree techniques used for classification of a dataset. They provide a set of rules that you can apply to a new (unclassified) dataset to predict which records will have a given outcome. CART segments a dataset by creating 2-way splits while CHAID segments using chi square tests to create multi-way splits. CART typically requires less data preparation than CHAID.
- Nearest neighbor method: A technique that classifies each record in a dataset based on a combination of the classes of the k record(s) most similar to it in a historical dataset (where k 1). Sometimes called the k-nearest neighbor technique.
- Rule induction: The extraction of useful if-then rules from data based on statistical significance.
- Data visualization: The visual interpretation of complex relationships in multidimensional data. Graphics tools are used to illustrate data relationships.
What technological infrastructure is required?
Today, data mining applications are available on all size systems for mainframe, client/server, and PC platforms. System prices range from several thousand dollars for the smallest applications up to $1 million a terabyte for the largest. Enterprise-wide applications generally range in size from 10 gigabytes to over 11 terabytes. NCR has the capacity to deliver applications exceeding 100 terabytes. There are two critical technological drivers:
- Size of the database: the more data being processed and maintained, the more powerful the system required.
- Query complexity: the more complex the queries and the greater the number of queries being processed, the more powerful the system required.
Relational database storage and management technology is adequate for many data mining applications less than 50 gigabytes. However, this infrastructure needs to be significantly enhanced to support larger applications. Some vendors have added extensive indexing capabilities to improve query performance. Others use new hardware architectures such as Massively Parallel Processors (MPP) to achieve order-of-magnitude improvements in query time. For example, MPP systems from NCR link hundreds of high-speed Pentium processors to achieve performance levels exceeding those of the largest supercomputers.
CRISP-DM is a widely accepted methodology for data mining projects. The steps in the process are:
- Business Understanding: Understand the project objectives and requirements from a business perspective, and then convert this knowledge into a data mining problem definition and a preliminary plan designed to achieve the objectives.
- Data Understanding: Start by collecting data, then get familiar with the data, to identify data quality problems, to discover first insights into the data, or to detect interesting subsets to form hypotheses about hidden information.
- Data Preparation: Includes all activities required to construct the final data set (data that will be fed into the modeling tool) from the initial raw data. Tasks include table, case, and attribute selection as well as transformation and cleaning of data for modeling tools.
- Modeling: Select and apply a variety of modelling techniques, and calibrate tool parameters to optimal values. Typically, there are several techniques for the same data mining problem type. Some techniques have specific requirements on the form of data. Therefore, stepping back to the data preparation phase is often needed.
- Evaluation: Thoroughly evaluate the model, and review the steps executed to construct the model, to be certain it properly achieves the business objectives. Determine if there is some important business issue that has not been sufficiently considered. At the end of this phase, a decision on the use of the data mining results is reached.
- Deployment: Organize and present the results of data mining. Deployment can be as simple as generating a report or as complex as implementing a repeatable data mining process.
Data mining is iterative. A data mining process continues after a solution is deployed. The lessons learned during the process can trigger new business questions. Changing data can require new models. Subsequent data mining processes benefit from the experiences of previous ones.